For field supervisors and operations managers, safety is managed shift by shift — not month by month. The Real-Time Operations Dashboard is built for daily use, tracking the ground-level safety metrics that matter most in the moment: open hazards, days since last incident, pre-shift inspection status, active permits, JSA completion, and daily incident counts. It closes the gap between the executive dashboard on the wall and the realities of the worksite.
KPIs & Metrics Tracked:
▸ Open Hazards count — identified hazards not yet controlled or resolved
▸ Days Since Last Recordable Incident — the classic safety culture counter
▸ Daily Inspection Completion Status — pre-shift, equipment, and area inspections
▸ JSA/JHA Completion Rate — analysis completed before high-hazard tasks
▸ Active Permit-to-Work Status — confined space, hot work, line break, and other permits
Dashboard Features:
✓ Daily data entry format — designed for shift-by-shift use
✓ Open hazard aging tracker with response time monitoring
✓ Permit-to-work log with issue date, scope, and closure status
✓ Days since last incident counter with milestone tracking
Scorecard with response time benchmarks (24-hr critical, 72-hr non-critical

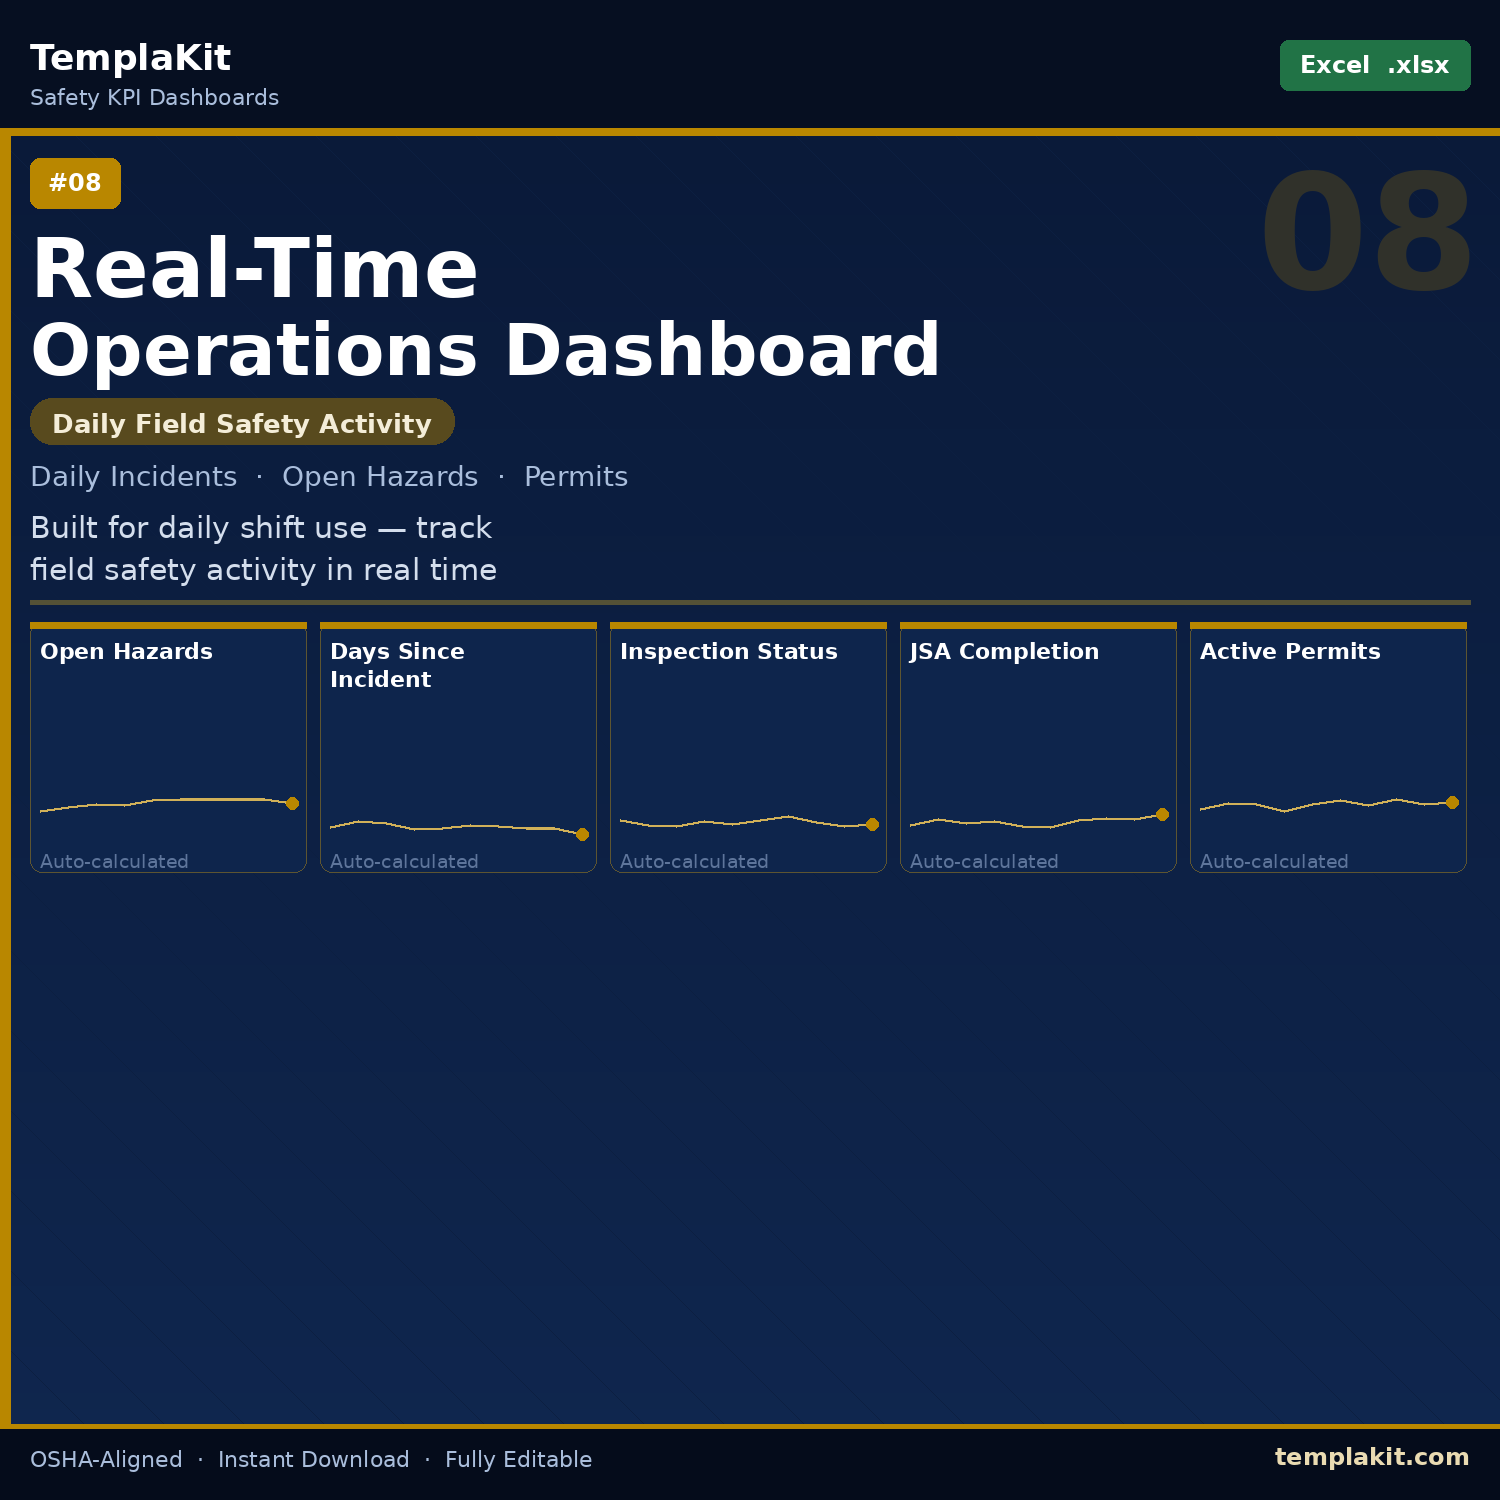 Image 1 of 1