Every safety program needs a clear view of historical outcomes — and this dashboard delivers exactly that. The Lagging Indicator Dashboard tracks your most critical after-the-fact metrics — TRIR, LTIR, DART Rate, Severity Rate, and Near Miss Rate — and automatically benchmarks your performance against BLS industry averages. Whether you're preparing for an executive briefing, entering insurance renewal season, or conducting a year-end safety review, this dashboard transforms raw incident data into clear, actionable visuals.
KPIs & Metrics Tracked:
▸ TRIR (Total Recordable Incident Rate) with auto-calculated formula
▸ LTIR (Lost Time Injury Rate) and DART Rate trend tracking
▸ Severity Rate — measures the depth of injury impact, not just frequency
▸ Near Miss Rate — tracks reporting culture health
▸ EMR (Experience Modification Rate) field and industry benchmark comparisons
Dashboard Features:
✓ Auto-calculated KPIs from raw input data (yellow cells only)
✓ Monthly trend charts that update automatically
✓ Color-coded scorecard: Green / Yellow / Red performance thresholds
✓ Industry benchmark reference data (BLS national averages by industry)
✓ Executive summary notes field, cover page, and full instructions tab

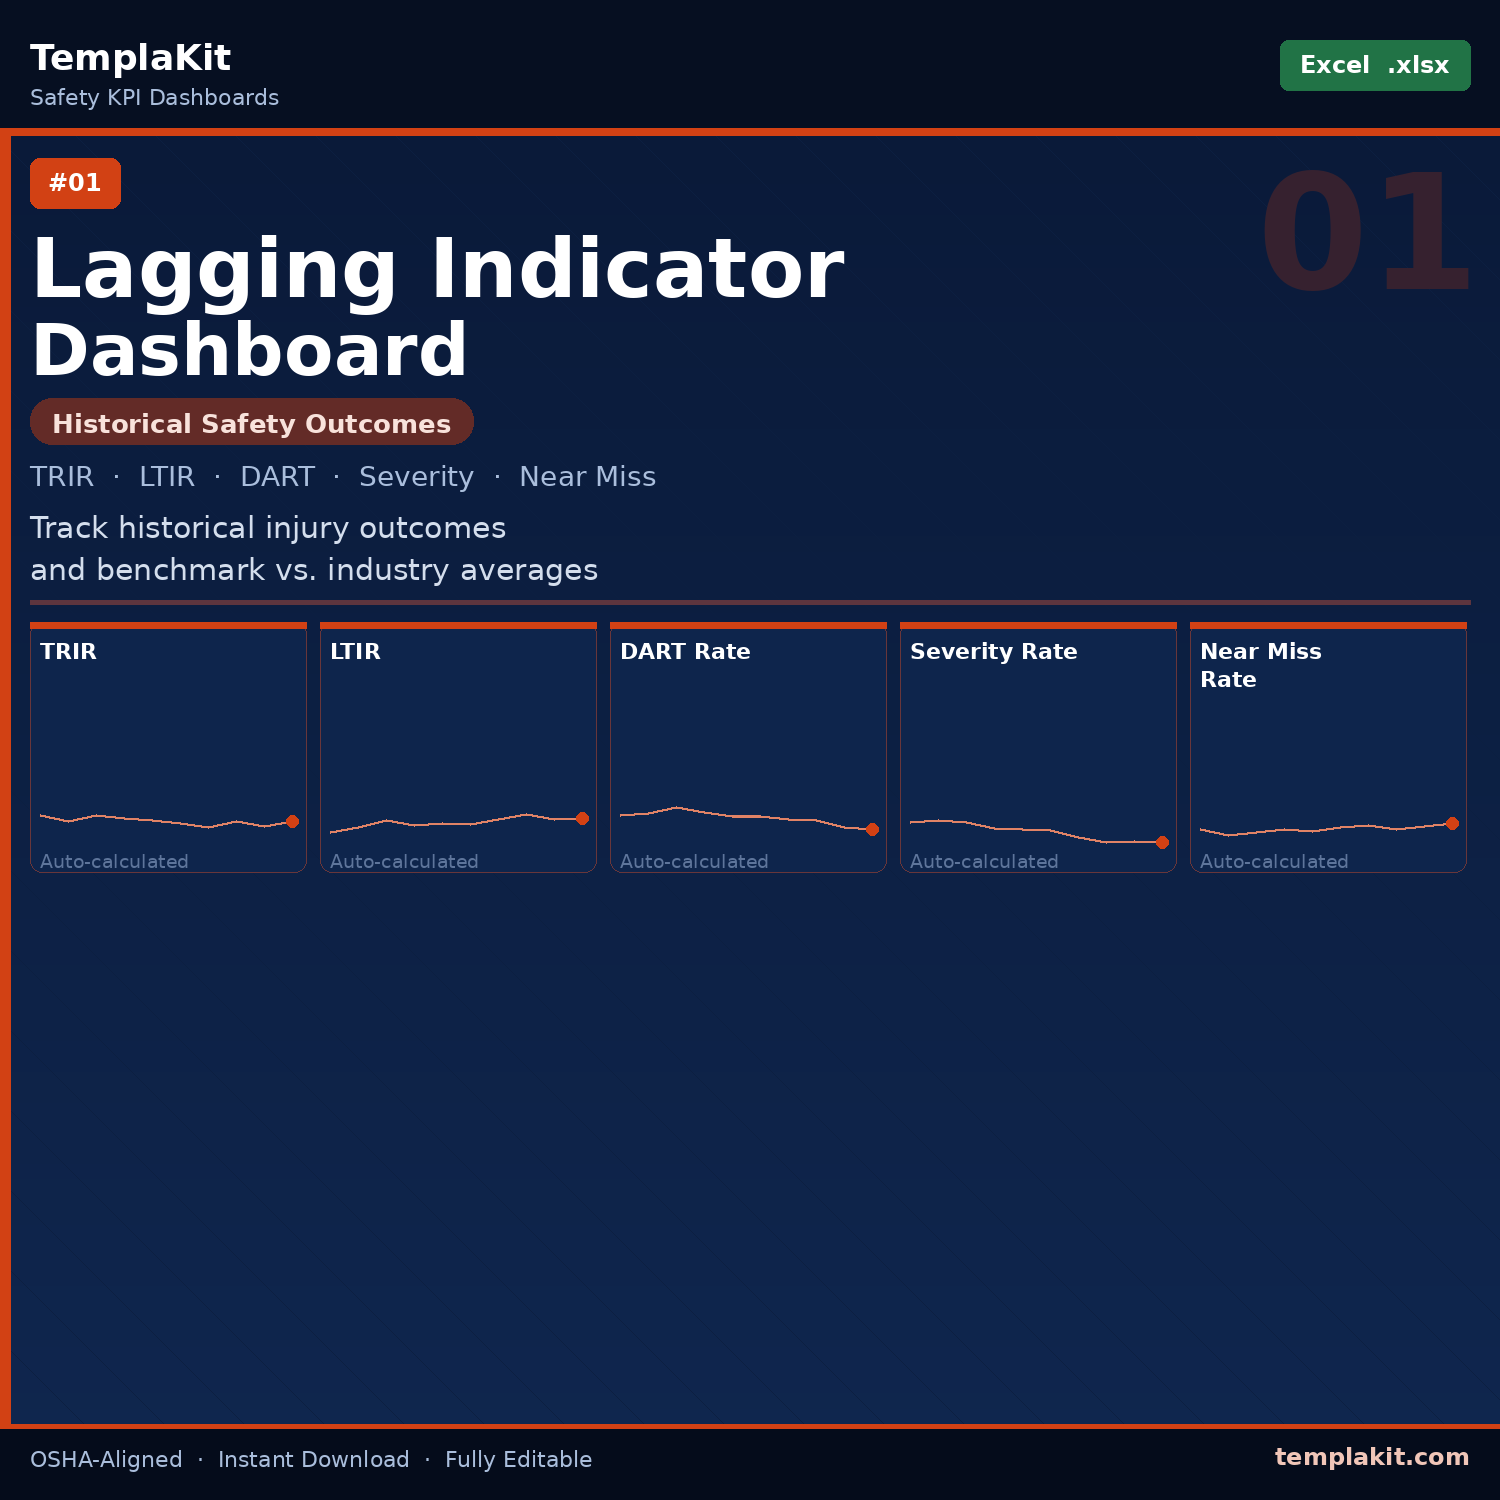 Image 1 of 1