Behavior-based safety programs are only as effective as the data behind them. This dashboard brings structure and visibility to your BBS process by tracking safe vs. unsafe observation ratios, participation rates, at-risk behavior frequency, and observer training status. Month-over-month behavior trend analysis helps safety managers identify persistent unsafe behaviors, reward positive trends, and demonstrate BBS program ROI to leadership.
KPIs & Metrics Tracked:
▸ % Safe — safe behaviors observed / total observations × 100 (target: ≥90%)
▸ Observation Participation Rate — completed vs. required observations
▸ At-Risk Behavior Frequency — tracks which unsafe behaviors recur most often
▸ Observer Training Rate — % of supervisors trained as certified BBS observers
▸ Behavior Trend — month-over-month change in % safe score
Dashboard Features:
✓ Monthly observation input log with safe/unsafe behavior counts
✓ Auto-calculated % Safe trend with target line overlay
✓ At-risk behavior frequency ranking (identify your top recurring hazards)
✓ Observer participation tracking by department or supervisor
✓ Color-coded scorecard with customizable target thresholds

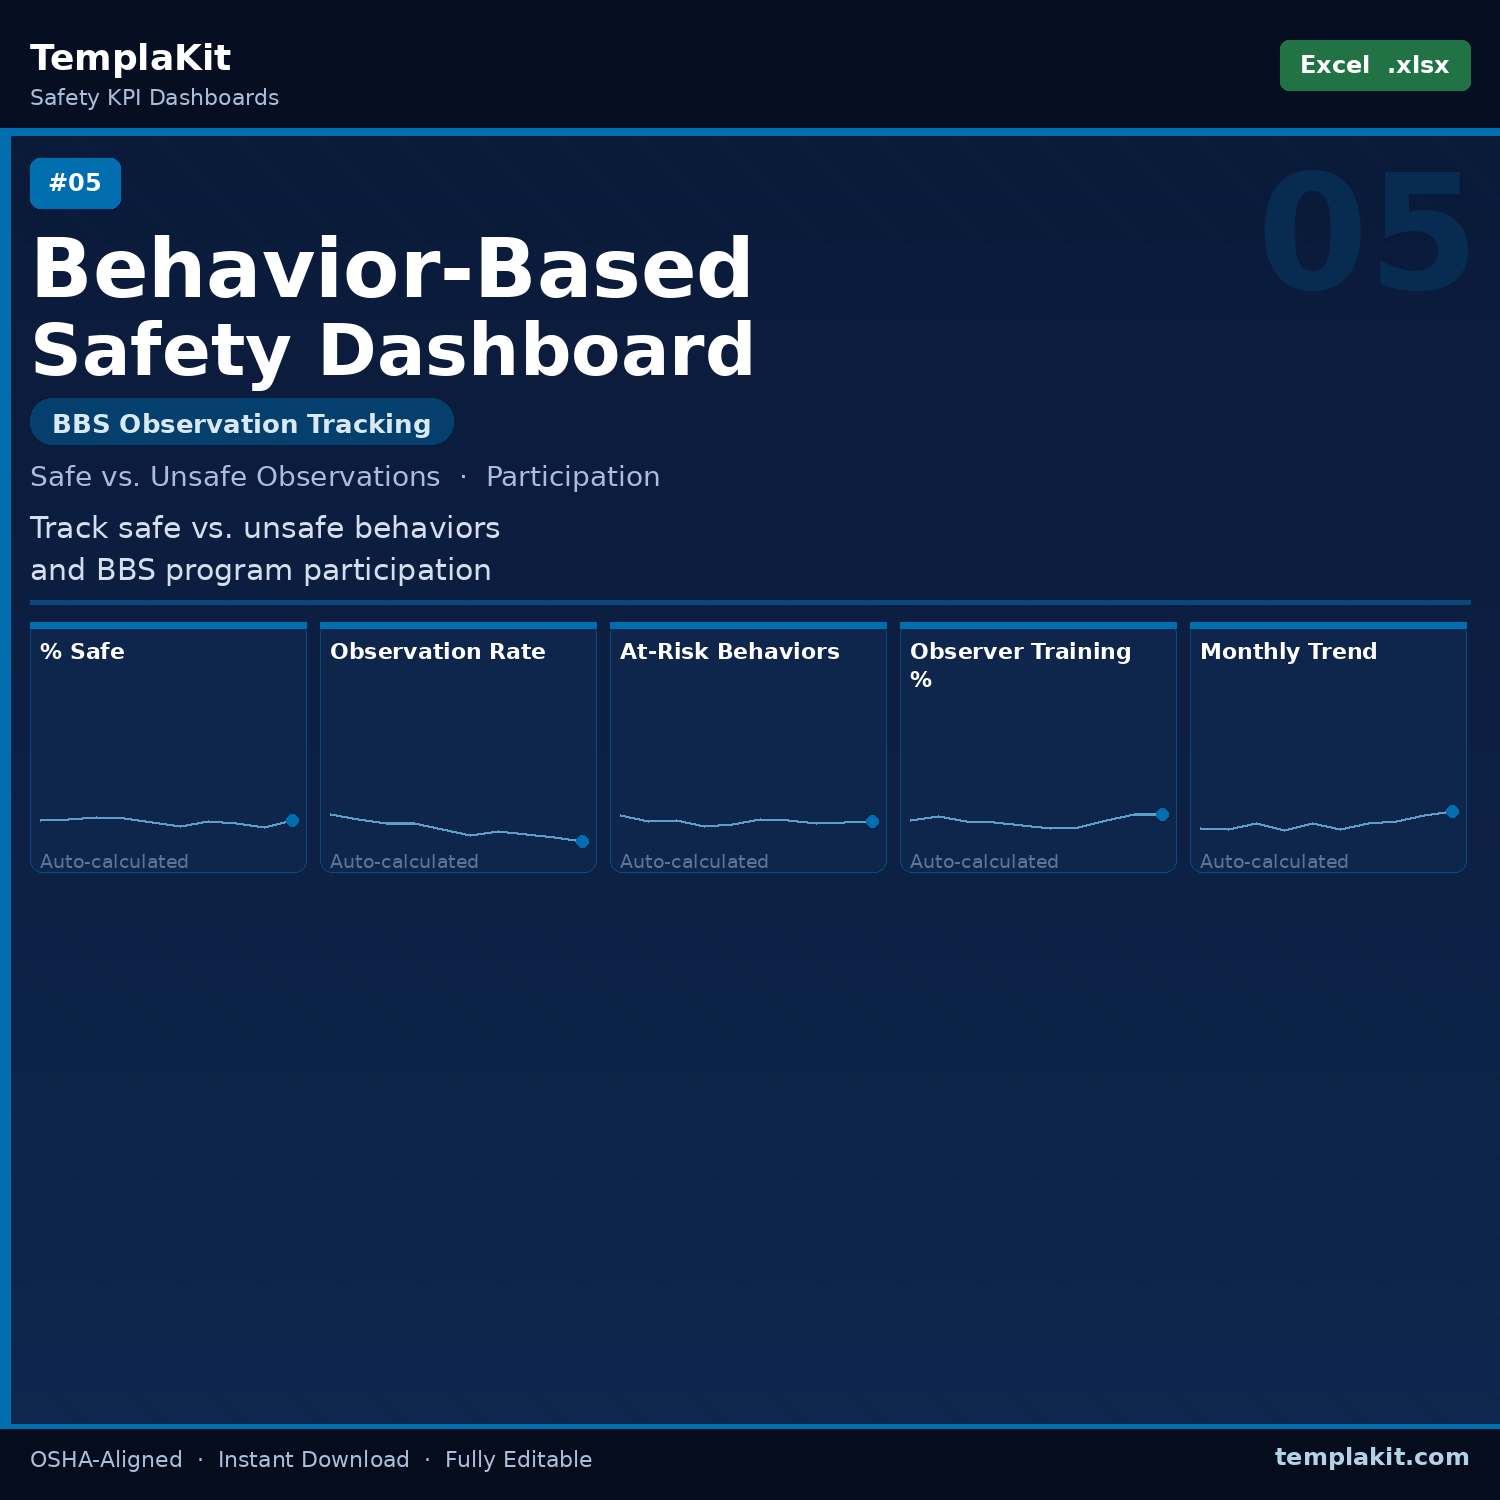 Image 1 of 1